
Dashboard Development Services
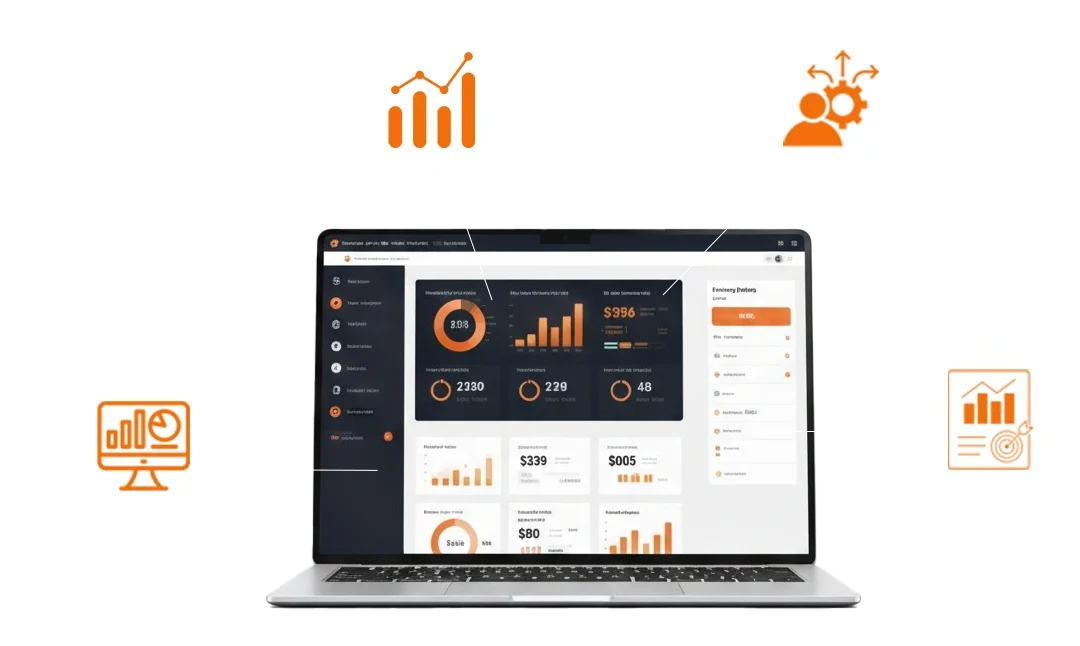
Are you trying to make sense of all your business data? It can be tough to know exactly what’s working and what isn’t when information is scattered everywhere. We build custom dashboards that bring all your important data into one simple view.
Our reporting and dashboard development services help you see your performance at a glance, so your team can make informed decisions without delay.

Our Customers








Our App Development Services
Discover & Plan
We analyze your data sources, understand stakeholder requirements, and define the KPIs that matter most. Together, we create a clear roadmap for your dashboard solution.
Design & Prototype
Our UI/UX team crafts intuitive dashboard layouts focused on data visualization best practices. You’ll see interactive prototypes with sample data before development begins.
Develop & Test
We build robust, secure dashboard applications using modern frameworks. Rigorous testing ensures data accuracy, performance optimization, and cross-platform compatibility.
Deploy & Support
We handle seamless deployment and provide ongoing maintenance, feature enhancements, and training to ensure your team maximizes dashboard value.
Industries We Serve
As a trusted product development company recognized by platforms like Clutch, VirtueNetz delivers reliable digital products for startups and enterprises across industries such as SaaS, eCommerce, education, logistics, and non profits.
Non-Profits
Construction & Real Estate
B2C Businesses
Public Sector
Voice Technology & AI
Food & Beverage
Health and wellness
Fitness & Lifestyle
Sports
Logistics
Transportation
Education & EdTech
HR
Textile Industry
Social Media & Networking
Automotive
Dashboard Solutions We Build for Businesses
We create purpose-built dashboard solutions that integrate with your workflows and deliver measurable insights. Each solution focuses on solving specific reporting challenges.
Executive Dashboards
High-level strategic overview combining financial performance, operational metrics, and market trends for C-suite decision making.
Operational Command Centers
Real-time monitoring of daily operations, inventory levels, service tickets, and production metrics with automated alerting.
Sales & Marketing Analytics
Track conversion funnels, campaign ROI, customer acquisition costs, and pipeline health with interactive drill-down capabilities.
Financial Performance Dashboards
Monitor cash flow, profit margins, budget vs. actuals, and financial ratios with secure, audit-ready reporting.
HR & Workforce Analytics
Visualize employee performance, turnover rates, recruitment metrics, and workforce planning data.
Customer Support Insights
Track response times, satisfaction scores, ticket resolution rates, and agent performance in real time.
Supply Chain & Logistics Monitoring
End-to-end visibility from procurement to delivery with inventory tracking, route optimization, and supplier performance metrics.
Healthcare & Education Analytics
Compliance reporting, patient/student outcomes tracking, and resource utilization dashboards for regulated industries.
Our 6-Step Dashboard Development Lifecycle
Discovery & Requirements Gathering
We deep-dive into your business processes, identify key stakeholders, and document what success looks like for your dashboard project.
Solution Architecture & Design
We create wireframes, define the visualization approach, select appropriate chart types, and architect the technical solution for performance and scalability.
System Integration
We seamlessly integrate with your existing tech stack – Salesforce, SAP, QuickBooks, Google Analytics, SQL databases, and more – ensuring smooth data flow.
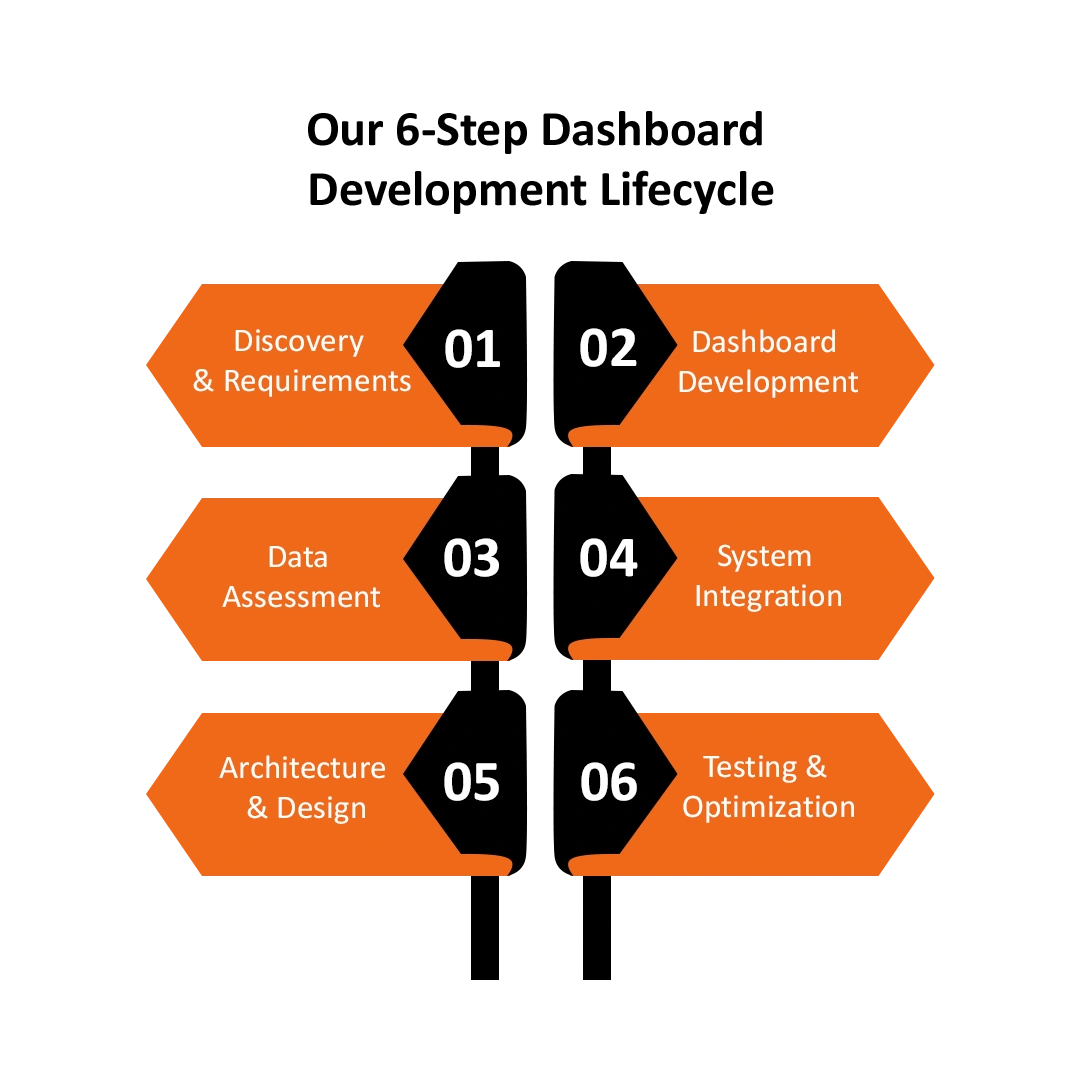
Data Source Assessment
We audit your existing data infrastructure databases, APIs, spreadsheets, and third-party tools to understand integration requirements and data quality.
Dashboard Development & Configuration
Our developers build the dashboard frontend, implement data connectors, create ETL processes, and configure interactive filters and drill-downs.
UAT, Testing & Optimization
We conduct user acceptance testing, validate data accuracy, optimize load times, and refine visualizations based on real user feedback before go-live.
Technology Stack We Use

Flutter

React Native

Swift

FireBase

Python

Kotlin

Node.JS
Laravel

MongoDB

PHP
Angular

Java
Testimonials
Trusted by innovators worldwide
VirtueNetz brought our vision to life. They built an incredible AI-powered analytics platform that has completely changed the way we make decisions. The communication throughout the project was smooth, and the quality of their work went above and beyond what we expected.

We needed a custom software solution that could scale with our business, and VirtueNetz delivered exactly what we needed — on time and within budget. Their full-stack development expertise really improved our operational workflows.

Partnering with VirtueNetz was a game-changer for our ecommerce platform. Their UI/UX design team took our complex business goals and turned them into a simple, intuitive user experience. Our engagement metrics have gone through the roof!

The AI development services from VirtueNetz were beyond impressive. They helped us create a smart recommendation engine that now drives 40% of our user interactions. They’ve truly been a strategic partner for us.

VirtueNetz is the definition of professional, proactive, and skilled. They took our mobile app idea and executed it flawlessly. The milestones were clear, the delivery was quick, and their support after launch has been fantastic.

FAQs
Dashboards provide a visual representation of key metrics and data, helping teams track performance and make informed decisions quickly.
Building a custom dashboard involves defining goals, identifying key data points, connecting data sources, and designing a user-friendly interface.
Dashboards save time, improve decision-making, align teams, and provide real-time insights into business performance.
Dashboards can include financial data, sales metrics, customer insights, operational stats, and more, depending on business needs.
Let’s Build Your Dashboard
Looking for a custom solution? Email us at [email protected] or fill out the form below. We’ll get back to you within 24 hours.